Amid evolving climate goals, aging grid infrastructure, and rising energy costs, manufacturers must be more meticulous and intentional than ever regarding their energy consumption. Energy managers must implement sustainability initiatives to reach net zero, and these initiatives must be financially viable. Plus, many are grappling with increasing costs on their energy bills from things like Coincident Peak charges.
There is an opportunity to do both. By strategically using energy storage and distributed energy resources, manufacturing facilities can profitably pursue net zero.
In a fast-changing landscape, energy managers and engineers have new opportunities to manage energy usage to achieve cost-saving and emission-reduction objectives. While most facilities track traditional manufacturing KPIs — including overall energy cost (ECI) and consumption — other key metrics can unlock innovative ways to improve energy productivity.
Read on to learn three of the most important manufacturing KPIs for energy management and how to use them to save costs, boost energy productivity, and reduce emissions.
KPIs for energy management
Manufacturers should measure multiple key performance indicators to gauge factors such as production output, resource utilization, and cost efficiency. In energy management, this extends to evaluating how efficiently power is consumed, identifying areas for improvement, and ensuring sustainability.
Great KPIs become more than performance metrics; they are strategic tools for optimizing energy consumption.
Load Factor & Coincident Peak Charges
Load factor compares a facility’s average demand (load) to the maximum demand (peak load) over a defined period of time. It can be a measure of a facility’s energy efficiency.
The maximum demand, or peak load, is the highest energy usage over the period. As is the case for most buildings, manufacturing facility energy peaks typically happen during weather events: during extreme heat (and extreme cold) events in the early evening – this is when HVAC is running at full tilt and the sun goes down.
Expressed as a percentage, a high load factor (close to 100%) indicates more levelized and consistent energy use without large fluctuations. A low load factor, say 30%, indicates large “peaks” in electricity use.
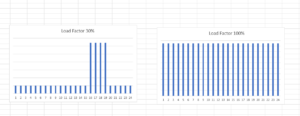
And the “peakier” your load, the higher your energy costs.
This is because the electricity system is designed to meet the maximum demand at any given time. To service that peak, the utility must have idle capacity, which imposes higher costs on the grid and the whole system. Facilities see those “demand charges” as either Coincident Peak or Non-Coincident Peak charges on their bills.
| These demand charges are also the two primary methods of generating savings on your energy bill, regardless of your utility and region. Here’s what each means:
● Coincident Peak (CP) Charges: Different regions have different names for this charge. In Ontario, it is Global Adjustment, and in Massachusetts and New York, it is ICAP. These savings are based on the highest demand period of an entire ISO region. ● Non-Coincident Peak (NCP) Charges: The savings generated on this area of the bill are known as “demand savings.” These savings are based on a facility’s highest demand hour over a specified time period. Sometimes, these events can overlap; for example, you could have one hour in the summer for both the NCP and CP. Discharging battery energy storage (BESS) for either (or both) of these value streams can generate the most significant savings for customers. |
To ensure the grid can handle peak demand, ISOs pass on “demand charges” to customers. The more you contribute to peak demand, the more you’ll have to pay.
Load factor formula:

Manufacturing facilities can improve load factor with two methods::
- Load shifting. This is a longer-term operational strategy that shifts load to lower demand periods of the day (resulting in lower costs of electricity). For some businesses, this could mean an operational decision to run a night shift. Load shifting is a more stable, long-term operational decision.
- Peak shaving. Peak shaving is a shorter-term strategy that quickly reduces a building’s load to avoid spikes in overall grid demand to save on CP or NCP charges. To get full benefit of peak shaving, without having to manually curtail load with shutdowns, facilities should use energy storage. To enhance the positive impact of a peak shaving strategy, it is imperative to have optimal Peak demand forecasting, a core competency at Peak Power.
Energy Cost Per Unit
Along with overall energy consumption and costs, companies looking to become leaner and more energy efficient should also measure energy costs per unit. This metric compares the total energy costs over a specific time frame with how many units were manufactured in that time. The lower the energy cost per unit, the more efficiently a manufacturing facility is running.
Energy cost per unit formula:
Total energy cost / Number of units produced
Energy managers might look to decrease the energy cost per unit by:
- Lowering Energy Costs with Energy Storage: Using the same methodology mentioned above, you can lower your overall energy costs with optimized energy storage.
- Solar + Storage: Solar is one of the cheapest forms of energy production. Incorporating solar + storage solutions behind the meter can supplement supply and significantly reduce energy cost per unit. Plus, with the availability of incentives available, facilities can significantly reduce the costs of installing solar. And with Peak Power, we offer a no-cost energy storage solution via a shared savings agreement.
Energy Intensity
Energy intensity measures the amount of energy consumed per unit. That per unit measure could be per square foot or per widget.
The goal of monitoring energy intensity is to assess a facility’s energy efficiency and compare this to industry benchmarks or internal targets. This metric can also help identify inefficiencies, optimize processes, and reduce environmental impact. Energy intensity is typically expressed as kilowatt-hours (kWh) of energy consumed per unit.
Energy intensity formula:
Total energy consumed / number of units
As a manufacturer, you’re aiming for low energy intensity — The minimum energy possible per unit. A significant secondary benefit in improving energy intensity is that you save money, reduce reliance on the grid, and avoid Scope 2 emissions.
By lowering your energy intensity, you are also lowering the GHG intensity of your facility.
Solutions for manufacturing energy management challenges
So where should energy managers and engineers focus their efforts to improve these manufacturing KPIs most effectively?
Load shifting can certainly save energy costs more consistently. This is particularly impactful in places like California that employ time-of-use (TOU) pricing.
But, the most impactful way to reduce costs and emissions is through Energy Storage and Distributed Energy Resources like rooftop or on-site solar. This allows energy managers to reduce costs and reduce Scope 2 emissions without altering manufacturing output.
Energy storage helps companies implement long-term solutions to pursue climate goals and save energy costs.
At Peak Power, our end-to-end and no-cost storage solutions are key to getting more batteries and renewable energy resources in the ground so we can achieve our societal climate and energy transition goals.
Book a call with us to learn more about our solar and no-cost energy storage solutions.